Thermals from IGC logs - release
For an introduction to the topic see this post.
Calling in all hackers interested in gliding/paragliding: let's bring modern data mining into the sport! There's plenty of IGC files residing in various corners of the Internet.
Some time ago I've been experimenting with ~50GB of logs scraped from SoaringSpot (years 2002 - 2015), to plot maps of good/bad thermal regions. The results of my work are here. I believe, however, that more stuff can be discovered from this data set. Hence I've decided to release the thermal data set I've been using.
Data format
The data comes as a plain CSV file. One record represents a fragment of a glider track corresponding to circling inside a thermal, this is essentially the point of the entry and the point of the exit. Plus some extra, computed values. Description of the columns:
- lat_enter - WGS-84 latitiude of the entry, degrees
- lon_enter - WGS-84 longitude of the entry, degrees
- timestamp_enter - UTC time of the entry, seconds
- alt_enter - altitude AMSL of the entry, meters
- lat_exit - WGS-84 latitiude of the exit, degrees
- lon_exit - WGS-84 longitude of the exit, degrees
- timestamp_exit - UTC time of the exit, seconds
- alt_exit - altitude AMSL of the exit, meters
- dist_tkoff - distance from the takeoff point, kilometers
And the computed values, i.e. values implied by the above:
- vv - vertical velocity, meters / second
- sun_time_hours - local (Sun) time, hours
- sun_angle - Sun altitude, degrees
- sun_power - Sun radiation power, Watts / meter^2
The data about Sun angle/radiation power was computed using pysolar. Timestamps are standard UNIX timestamps, in UTC.
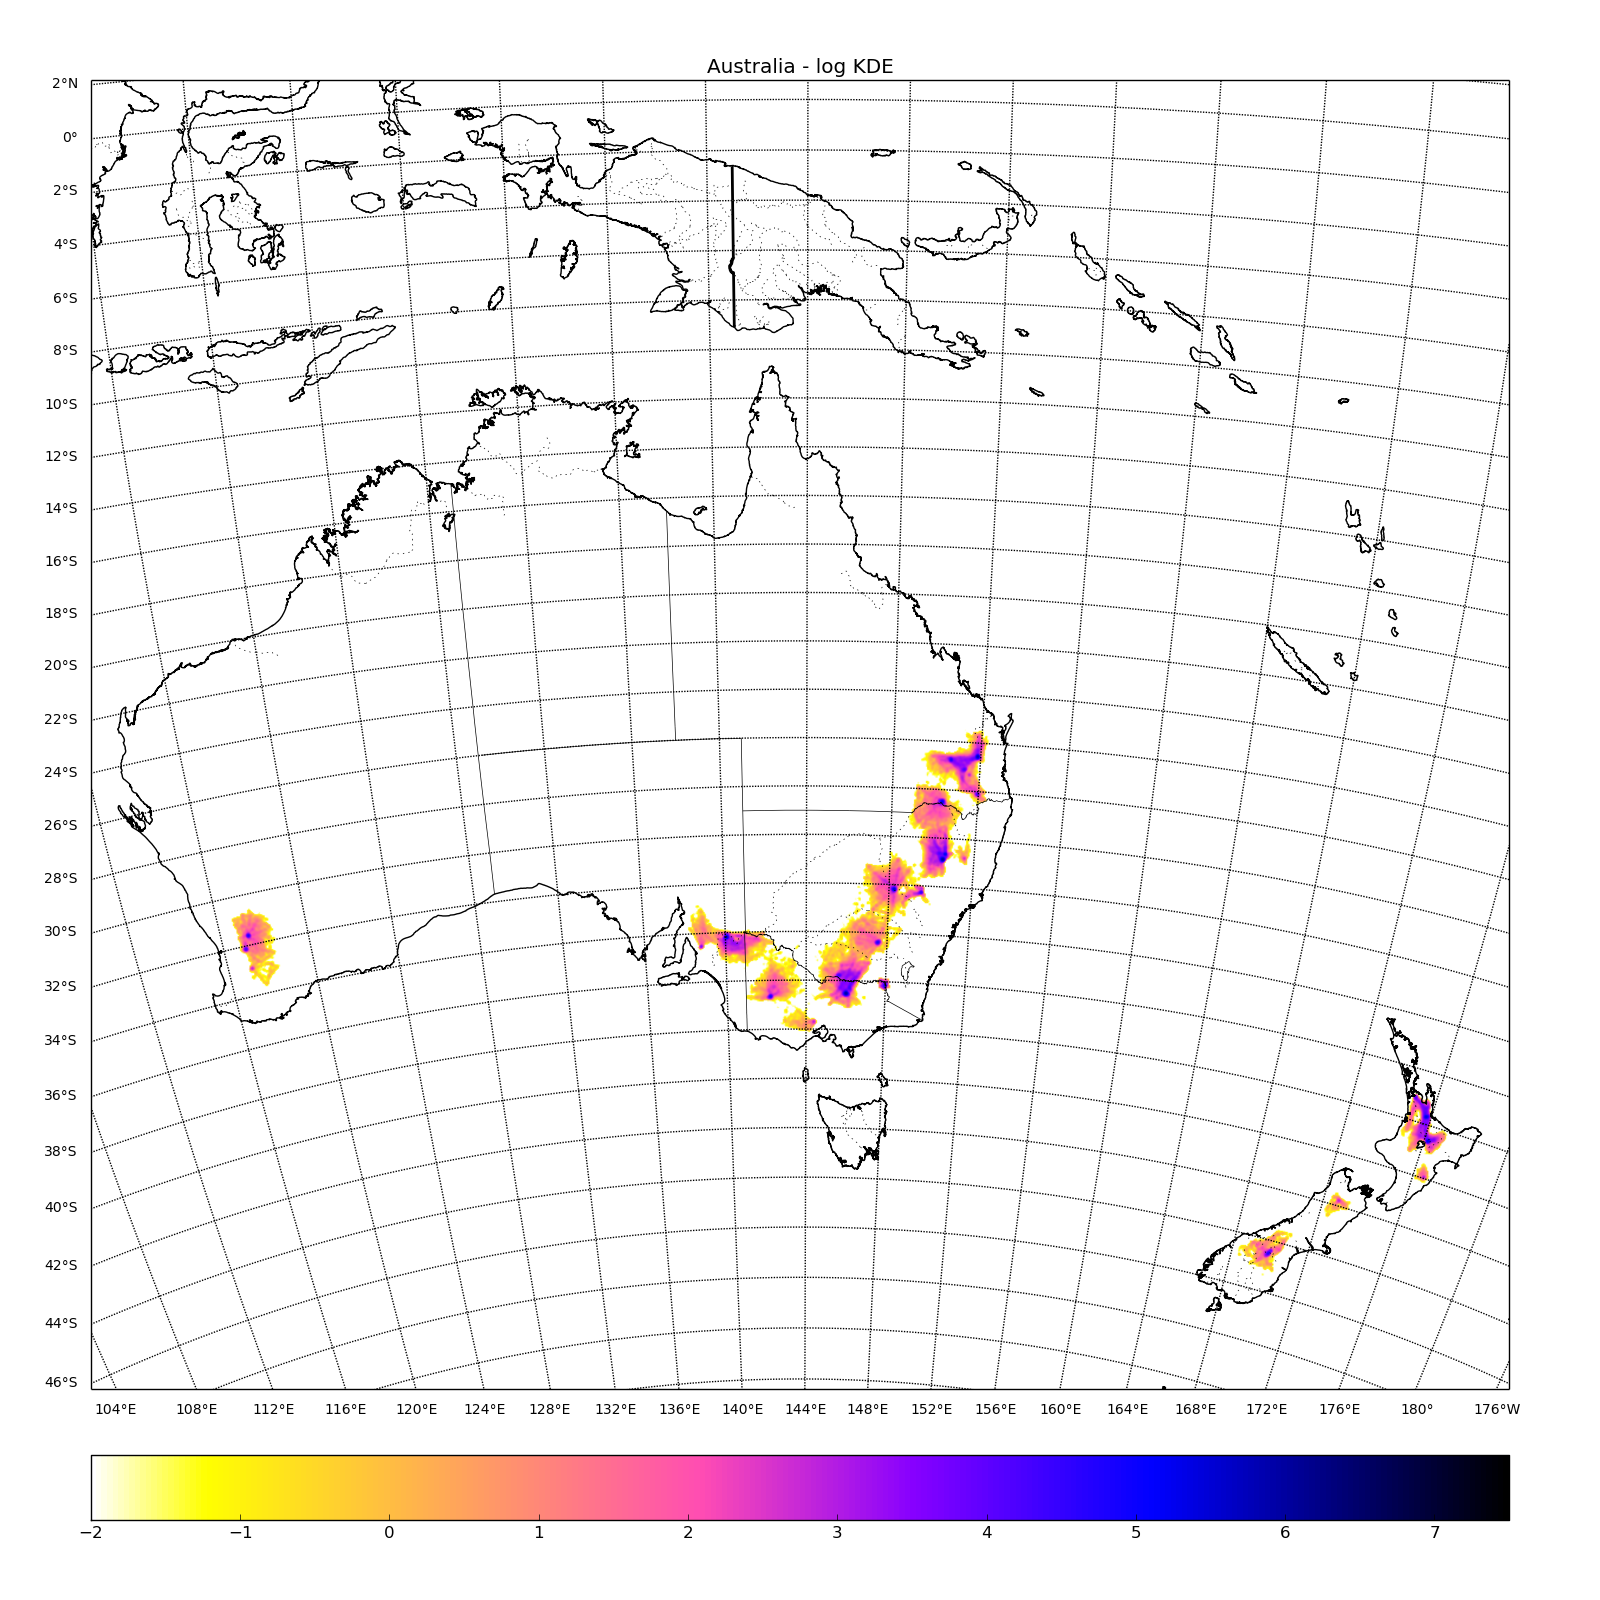
Geographic distribution
Vast majority of the thermals are in Europe:
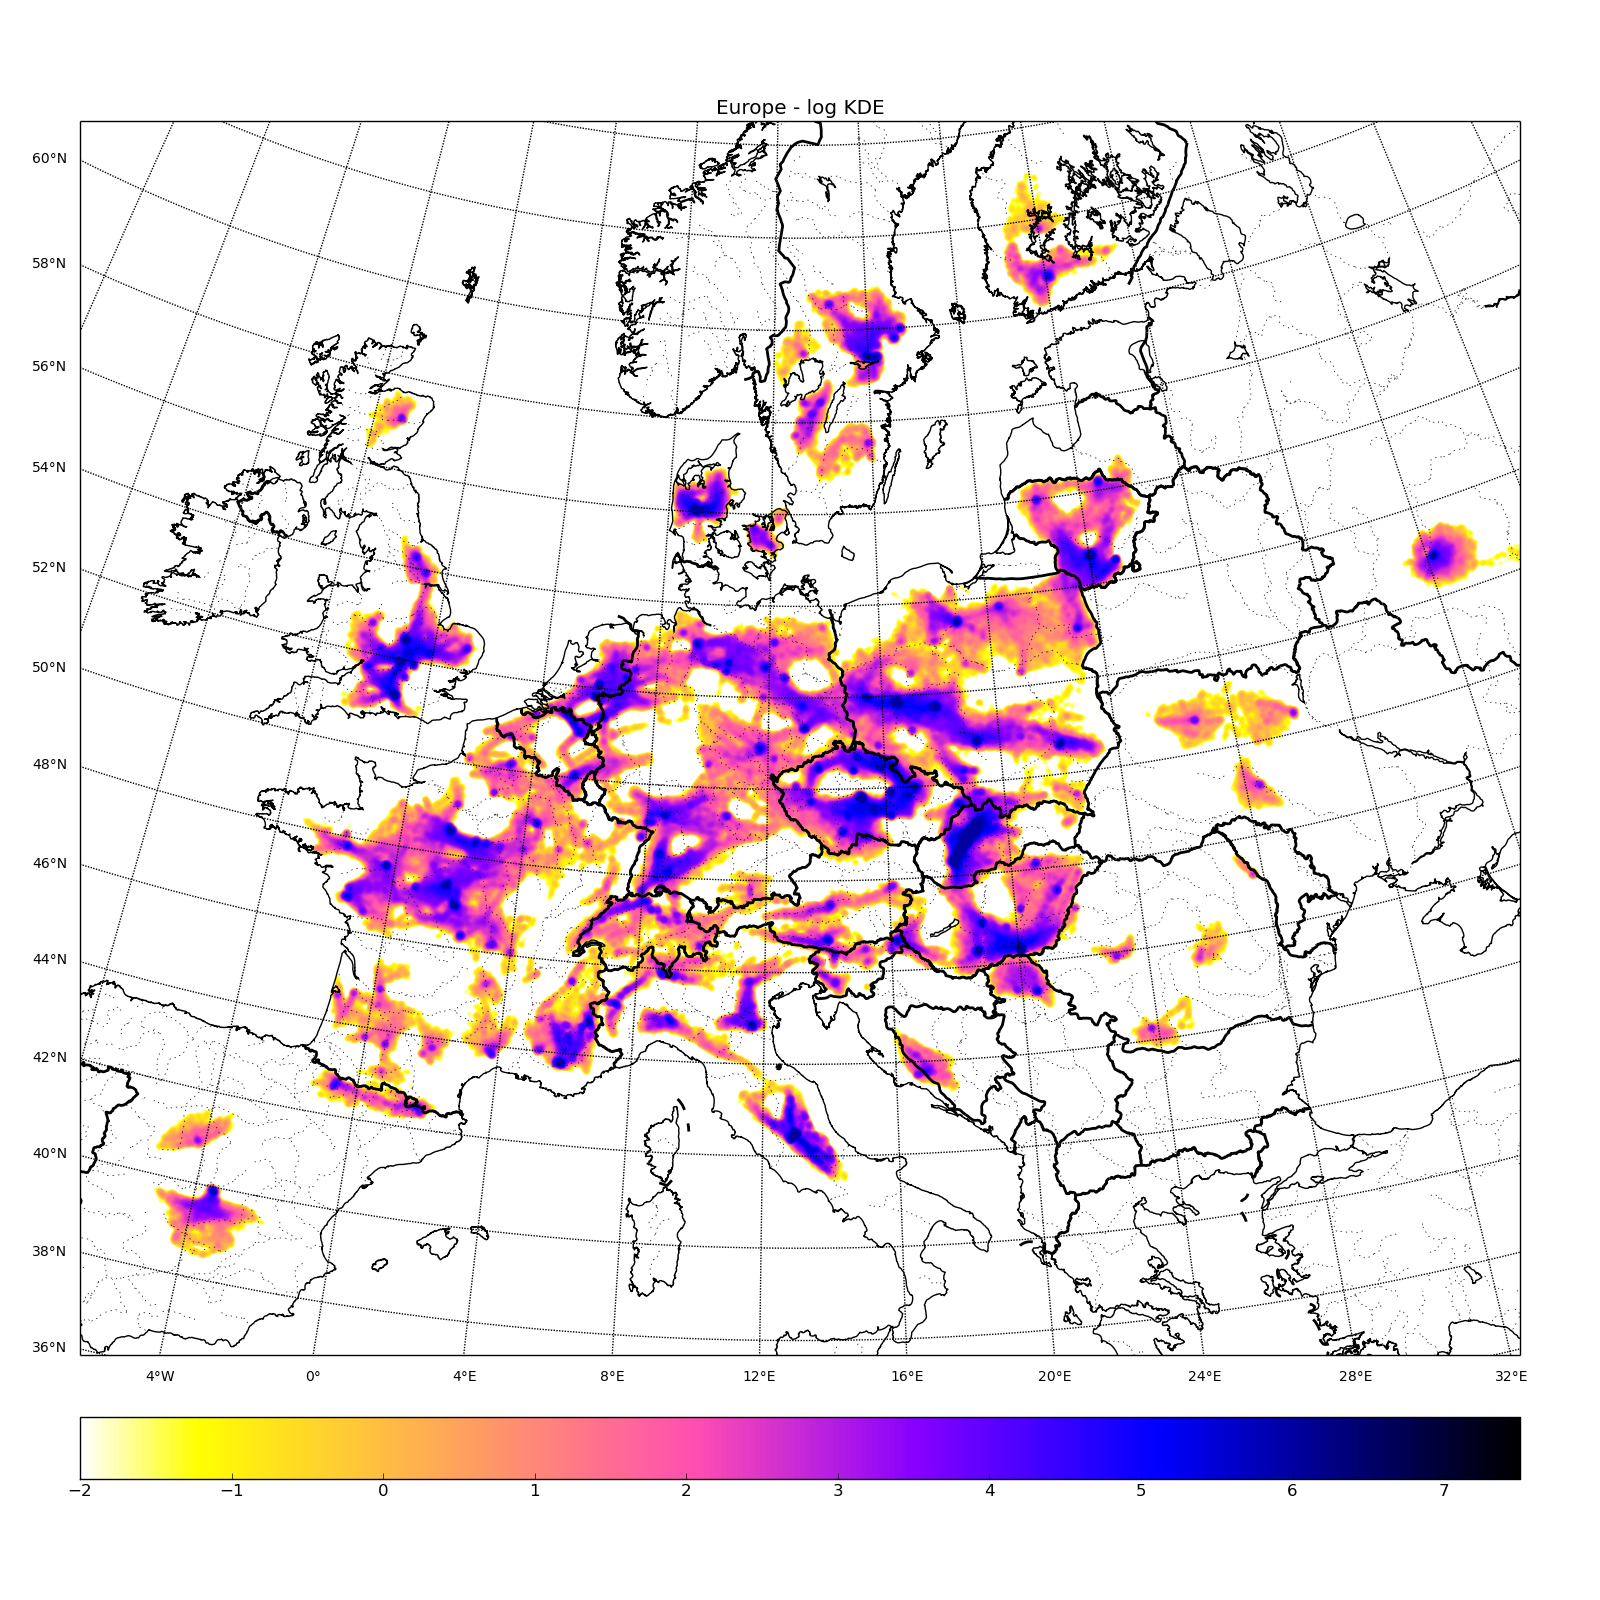
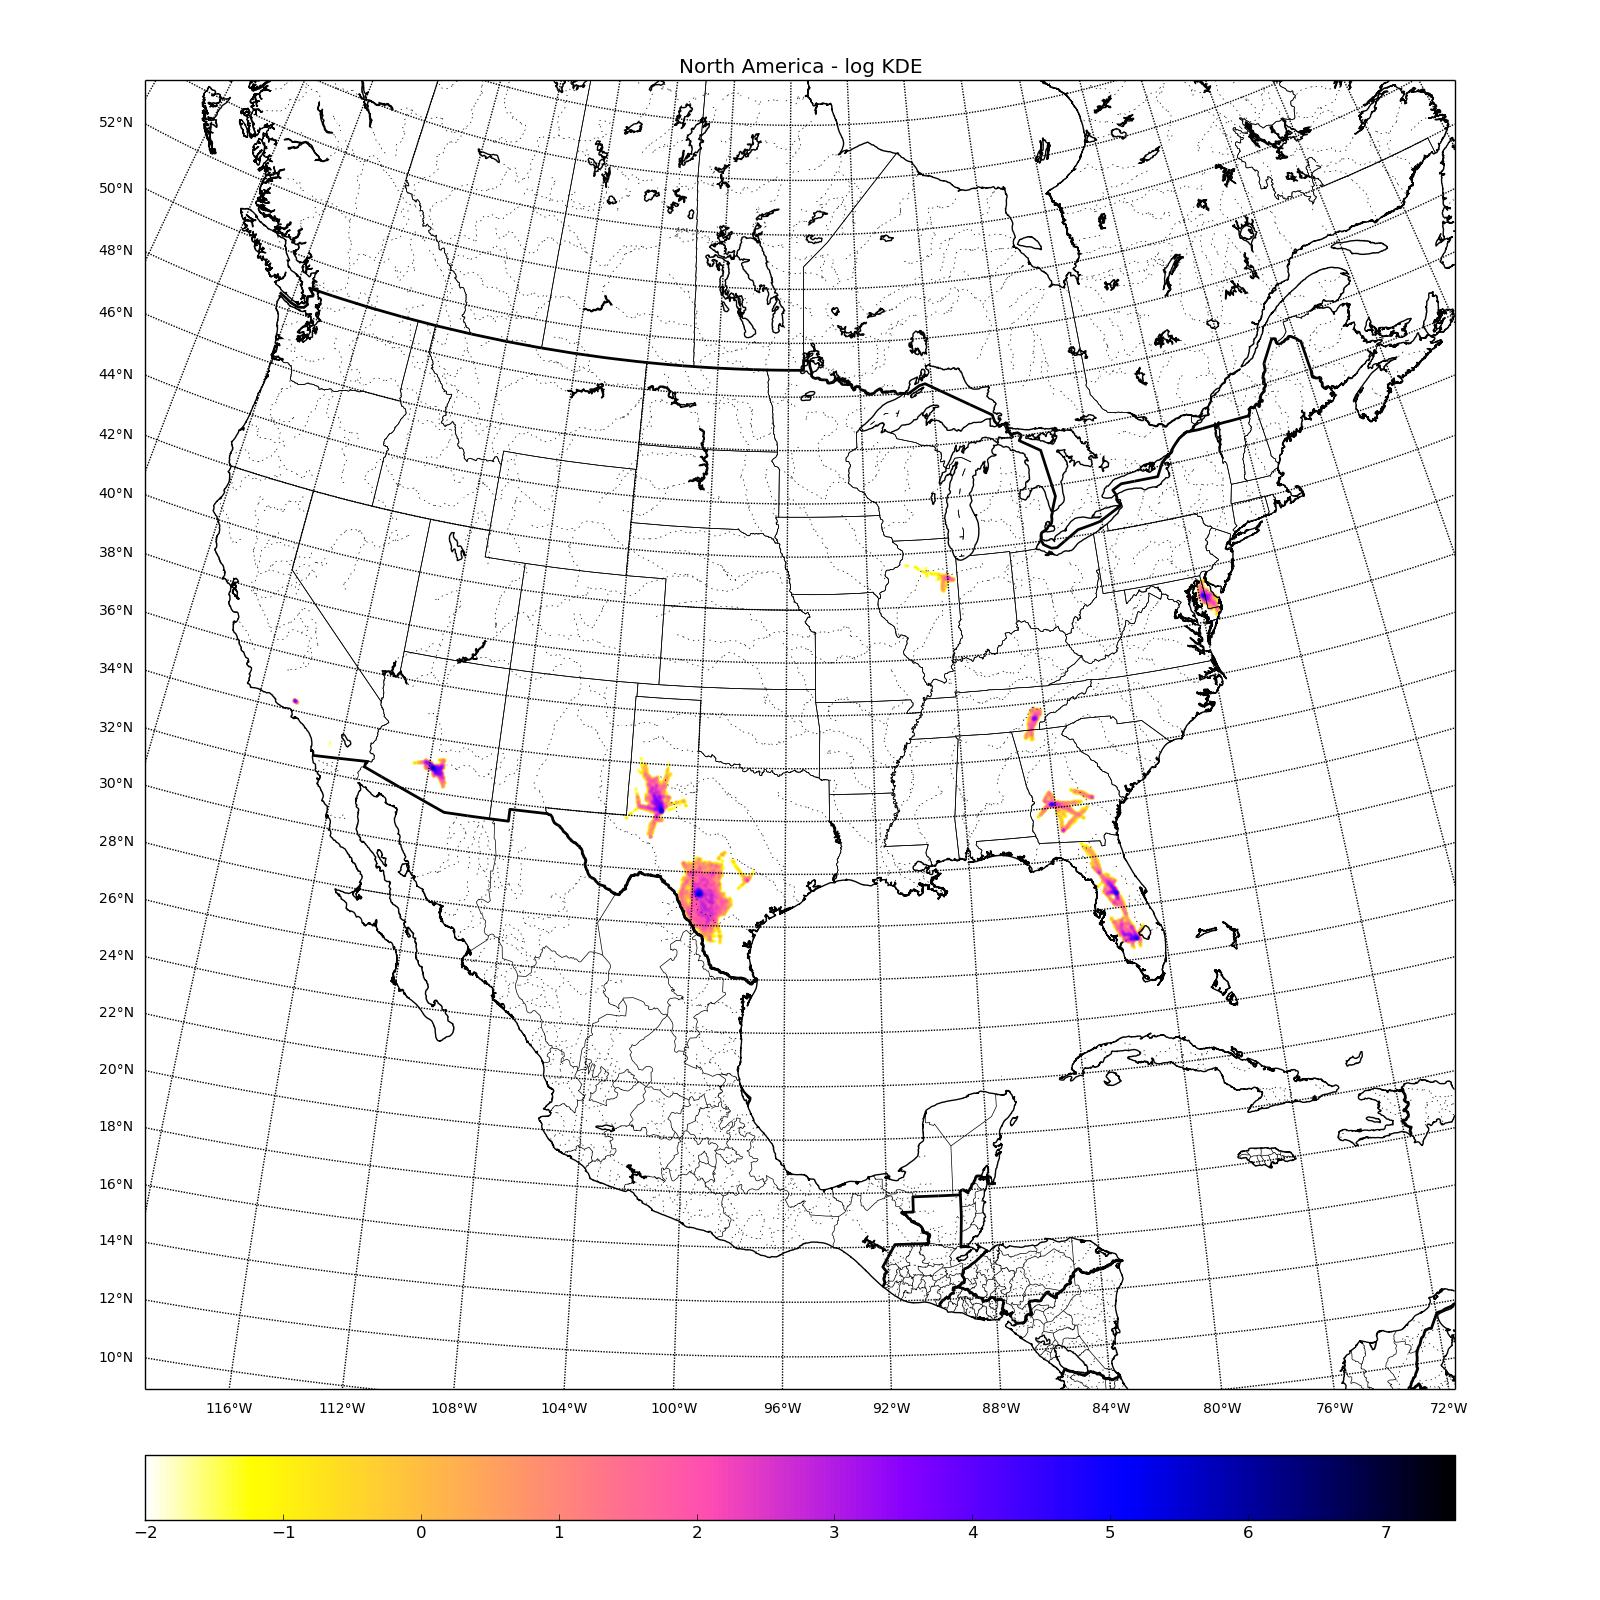
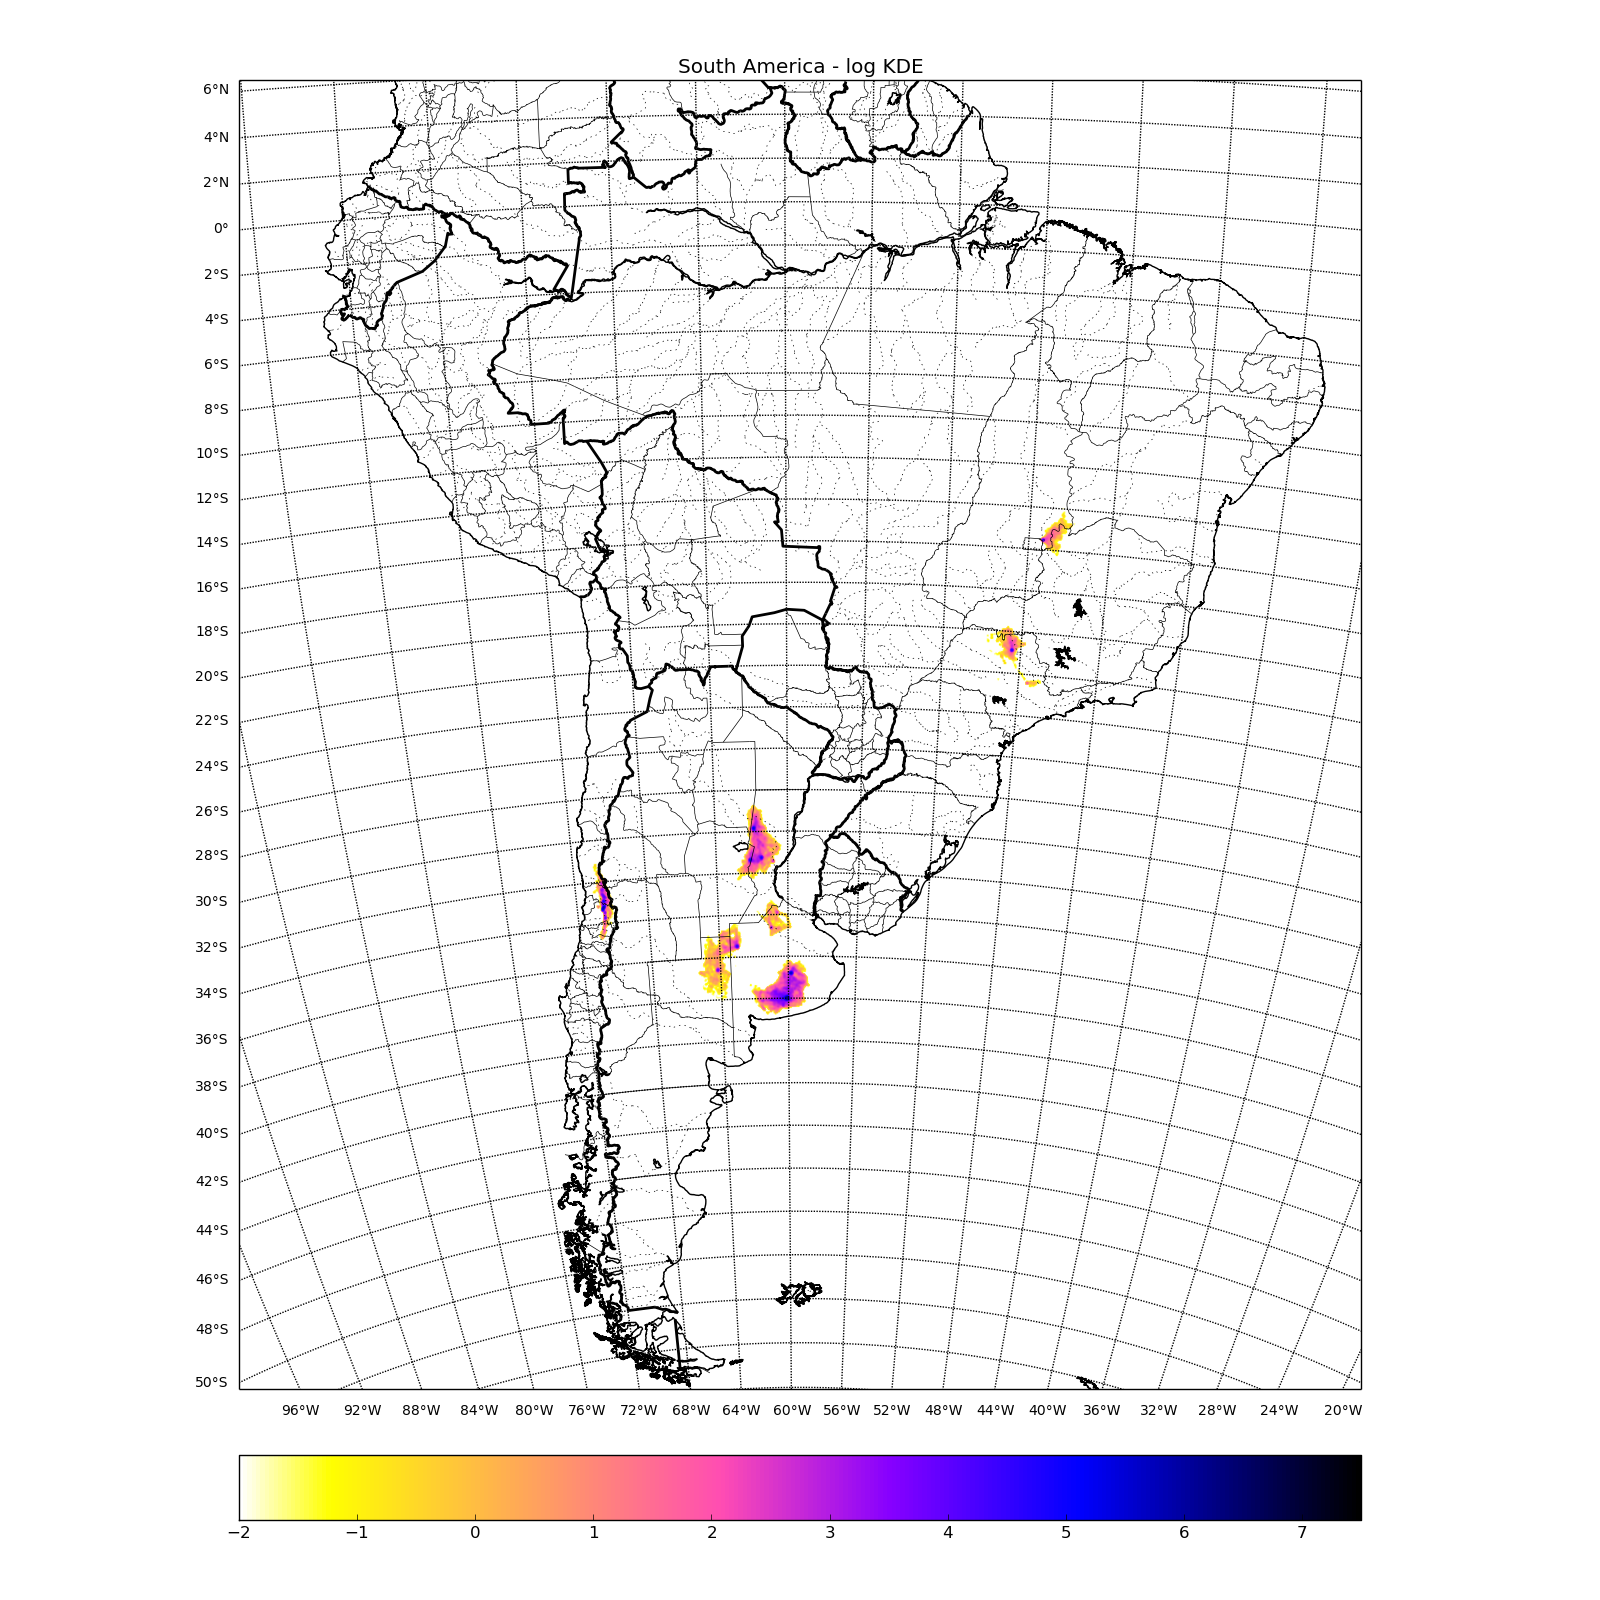
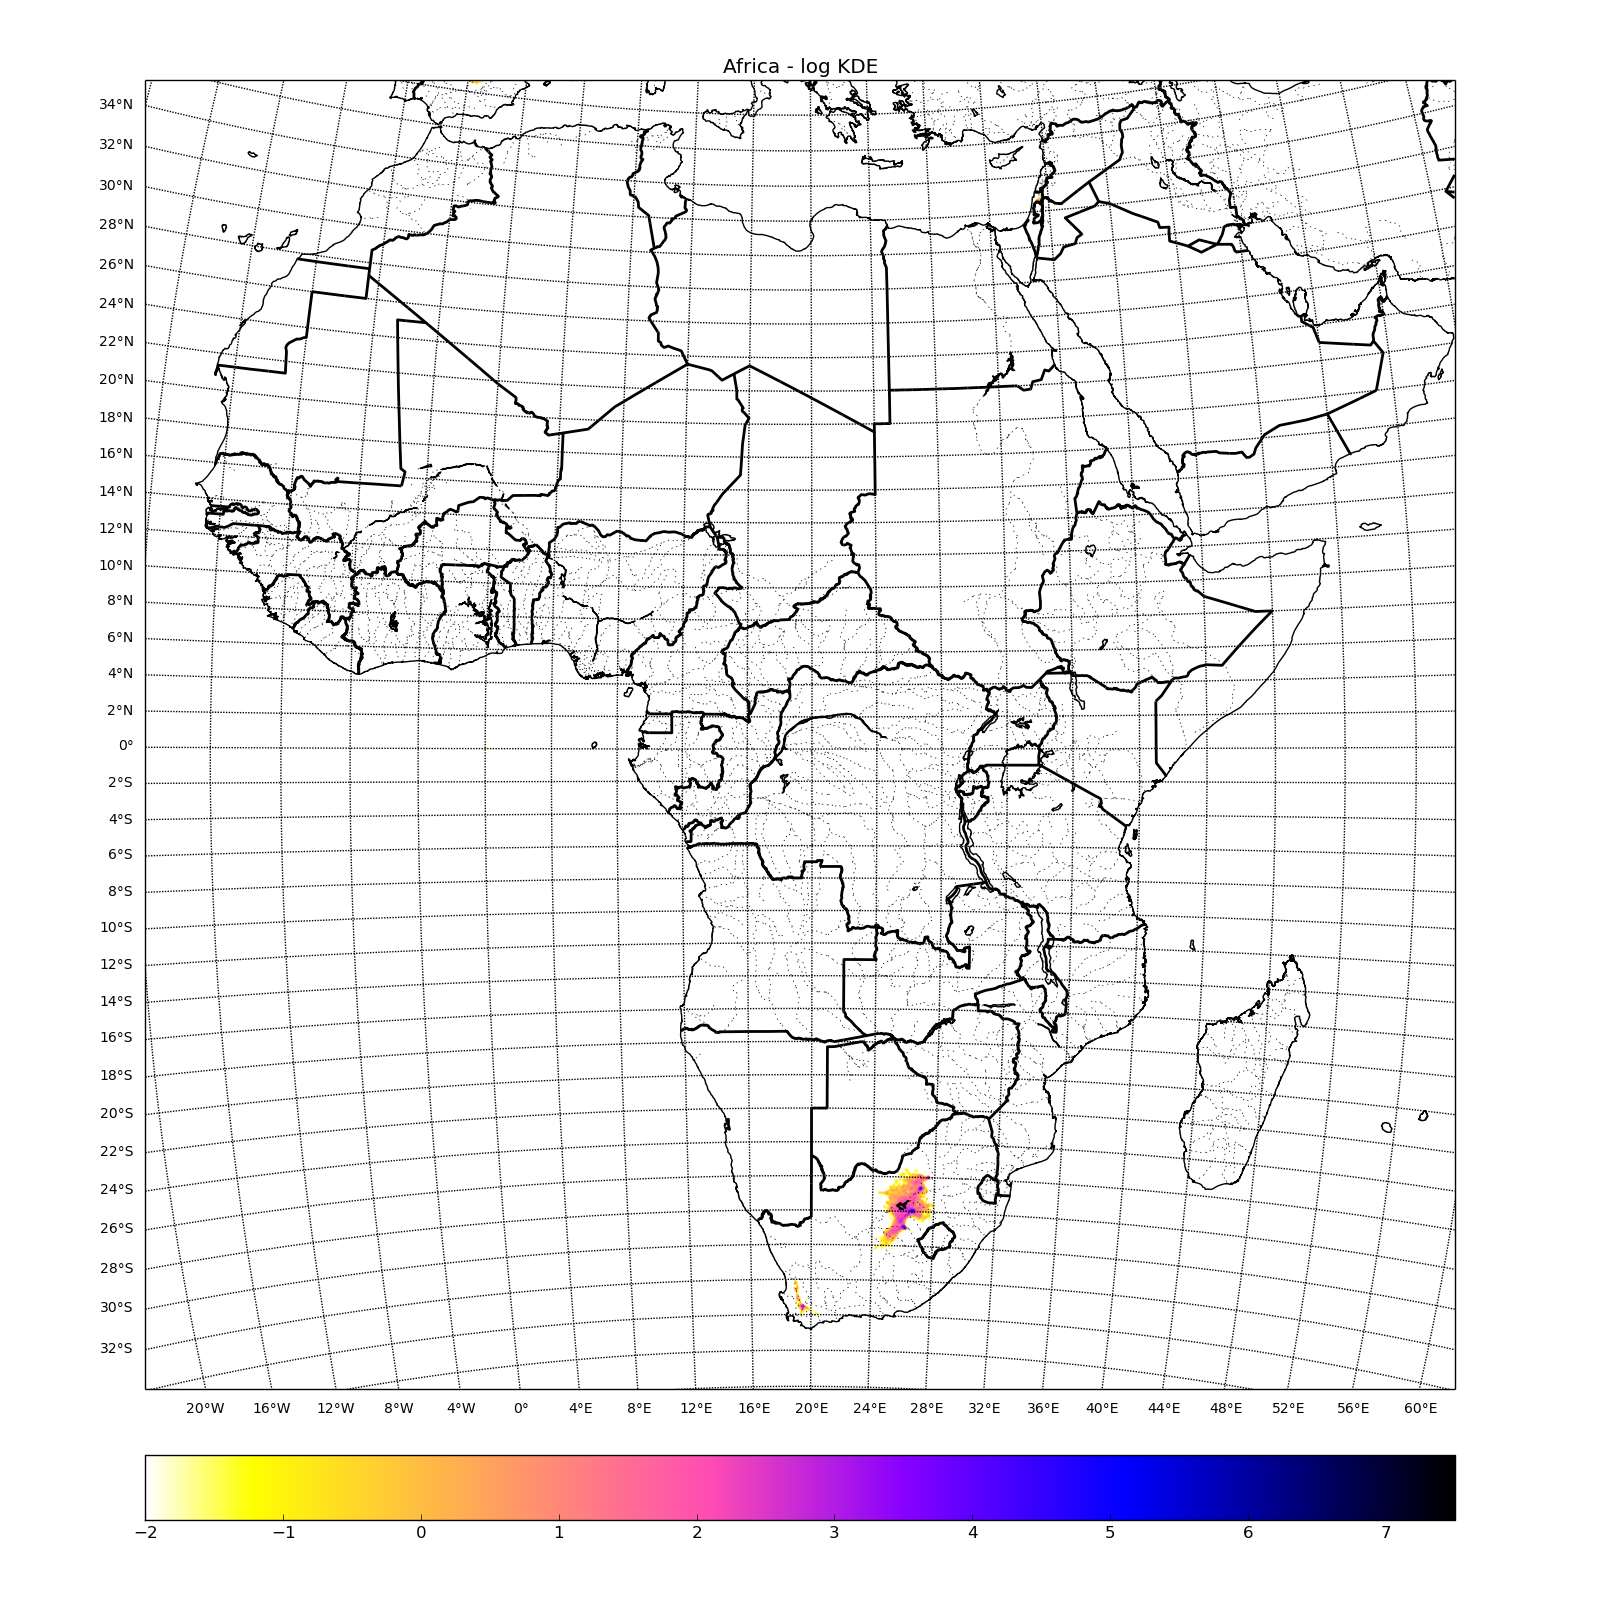
Per-continent density maps:
Download
In total, 235MB/746MB compressed/uncompressed, almost 5.000.000 thermals, based on 50GB of IGC files. BitTorrent download: